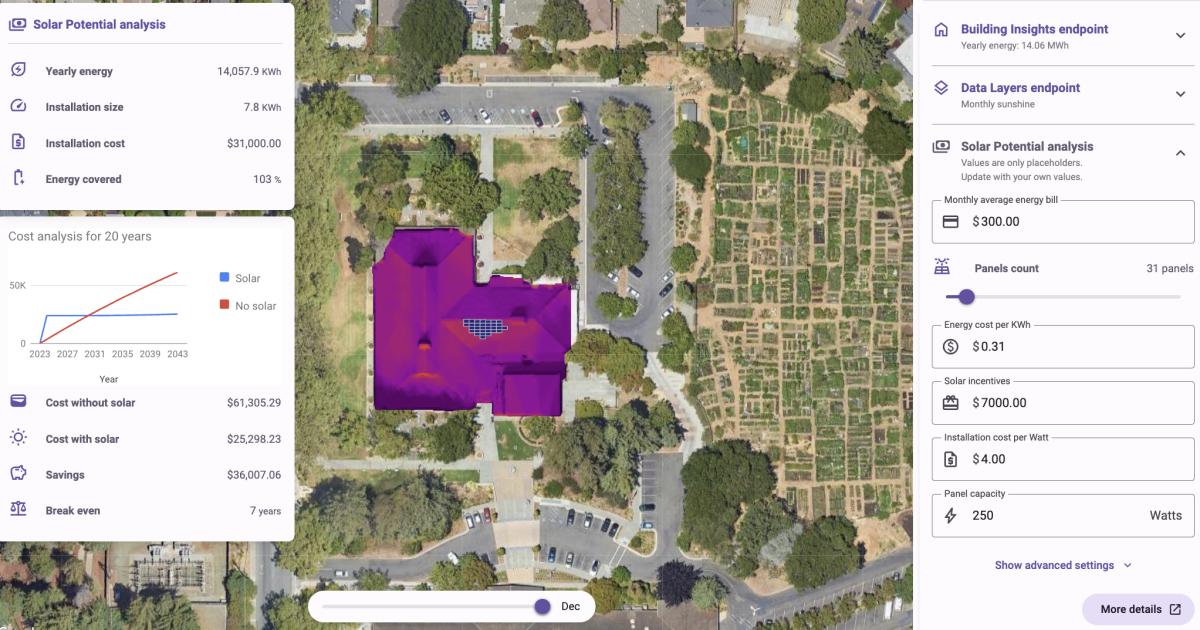
Way back in 2015, Google launched Project Sunroof, an ingenious Maps layer that combined location, sunlight and navigation data to show how much energy solar panels installed on a home’s roof might generate — it could be your house, could be your neighbor’s, didn’t matter because Google mapped it out for virtually every house on the planet. This was a clever way to both help advance the company’s environmental sustainability efforts and show off the platform’s technical capabilities.
On Tuesday at the Google Cloud Next event, the company will officially unveil a suite of new sustainability APIs that leverage the company’s AI ambitions to provide developers with real-time solar potential, air quality and pollen level information. With these tools, “we can work toward our ambition to help individuals, cities, and partners collectively reduce 1 gigaton of their carbon equivalent emissions annually by 2030,” Yael Maguire, VP of Geo Sustainability at Google writes in a forthcoming Maps blog post.
The Solar API builds directly from Project Sunroof’s original work, using modern maps and more advanced computing resources than its predecessor. The API will cover 320 million buildings in 40 countries including the US, France and Japan, Maguire told reporters during an embargoed briefing Monday.
“Demand for solar has been rising a lot in recent years,” Maguire said. He notes that search interest for ”rooftop solar panel and power” increased 60 percent in 2022. “We’ve been seeing this solar transition… and we saw a lot of opportunity to bring this information and technology to businesses around the world.”
The team trained an AI model to extract the precise angles and slopes of a given rooftop just from the overhead satellite or aerial photograph, along with shade estimates of nearby trees, and combine that with historical weather data and current energy pricing. This gives installation companies and homeowners alike a more holistic estimate of how much their solar specific panels could produce without having to physically send out a technician to the site.
Google is also expanding the Air Quality layer, which proved invaluable during the 2021 California Wildfires (and all the subsequent wildfires), into its own API offering for more than 100 countries around the world.
“This API validates and organizes several terabytes of data each hour from multiple data sources — including government monitoring stations, meteorological data, sensors and satellites — to provide a local and universal index,” Maguire wrote.
The system will even take current traffic conditions and vehicle volume into account to better predict what pollutants will be predominant. “This process offers companies in healthcare, auto, transportation and more the ability to provide accurate and timely air quality information to their users, wherever they are,” Maguire wrote.
In addition to human-generated pollutants, Google is also evolving its current pollen tracking Maps layer into a full API. “The rise in temperatures and greenhouse gas emissions also causes pollen-producing plants to grow in more places and pollen production to increase, creating additional adverse effects for those with seasonal allergies,” Maguire said.
The Pollen API will track the seasonal release of tree semen in more than 65 countries, incorporating local wind patterns and annual trends, providing users with local pollen count data, detailed allergen information and heatmaps of where the sneezing will be worst. Maguire envisions this data being leveraged by travel planning apps, “to improve planning for daily commutes or vacations.” The apps will be available to developers starting August 29th.


